
Observability
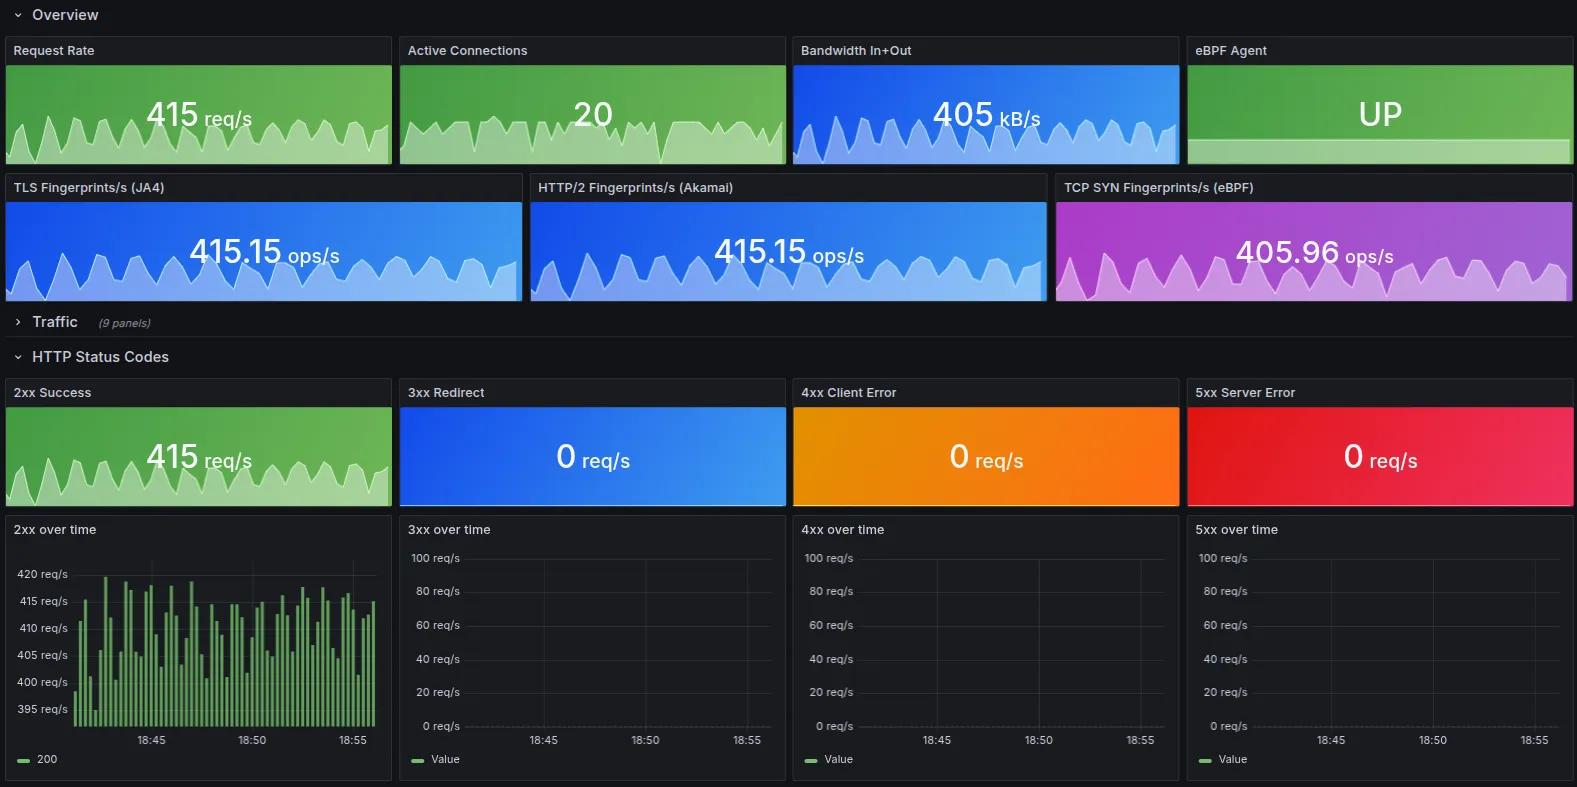
A pre-built Prometheus + Grafana stack ships with the repo. Grafana is pre-provisioned with a data source and a dashboard. No manual import or configuration needed.
Dashboard JSON: examples/grafana/dashboards/huginn-proxy.json.
Prerequisites
Section titled “Prerequisites”The main proxy stack must already be running and exposing ports on the host:
9090: proxy metrics (/metrics,/health,/ready,/live)9091: eBPF agent metrics (only when using the TCP SYN stack)
Prometheus reaches both via host.docker.internal from inside the observability containers.
Not running the main stack yet? Start here: Containers.
Start the observability stack
Section titled “Start the observability stack”Run from the repo root (not from examples/):
docker compose -f examples/docker-compose.observability.yml up -dThis starts Prometheus and Grafana as a separate Compose project. They scrape the proxy and the eBPF agent automatically.
Open Grafana
Section titled “Open Grafana”- Open
http://localhost:3000in your browser. - Log in with
admin/huginn. - The Huginn Proxy dashboard loads as the default home dashboard.
What the dashboard covers
Section titled “What the dashboard covers”| Panel | What you see |
|---|---|
| Overview | Request rate, active connections, error rate (client view), P95 latency, bandwidth |
| TLS | Handshake rate, TLS version and cipher distribution, error rate, P95 handshake duration |
| Fingerprinting | JA4 and HTTP/2 (Akamai) extraction rate, failure rate, P95 extraction duration |
| Rate limiting | Evaluation rate, rejection rate, breakdowns by strategy and route |
| Backends | Request rate, error rate, P95 latency, throughput per backend, health probe results |
| Config hot reload | Reload success/error rate, time since last successful reload, active config hash |
| eBPF agent | Agent up, TCP SYN captured / insert failures / malformed (when eBPF stack is running) |
Full PromQL for each panel: TELEMETRY.md: Grafana Dashboard Suggestions.
Prometheus scrape config (reference)
Section titled “Prometheus scrape config (reference)”The observability Compose file already wires this up. For custom deployments:
scrape_configs:  - job_name: huginn-proxy    static_configs:      - targets: ["localhost:9090"]    scrape_interval: 15s
  - job_name: huginn-ebpf-agent    static_configs:      - targets: ["localhost:9091"]    scrape_interval: 15s
Adjust hosts to your Docker/Kubernetes networking. See Telemetry for the full metric reference.
Related
Section titled “Related”- Telemetry: metric names, labels, and PromQL examples
- Containers: which stack to run first
- Kubernetes: health endpoints and scraping in K8s